Commercial kitchens enter 2026 under sustained pressure from food prices, labor shortages, energy bills, and stricter customer expectations. The National Restaurant Association’s 2025 State of the Restaurant Industry Report identifies operating costs and workforce challenges as continuing concerns for restaurant businesses. These pressures make “how to reduce costs in commercial kitchens” more than a search phrase. It becomes a daily management question.
The Energy Star program reports that restaurants use roughly five to seven times more energy per square foot than other commercial buildings. A poorly calibrated oven, an aging refrigerator, or a leaking door seal can quietly increase monthly expenses. Small details matter. ReFED’s food-waste research also shows that foodservice waste represents a major economic and environmental loss in the United States. Overproduction, oversized portions, and weak inventory rotation often turn usable ingredients into unpaid disposal costs.
Cost reduction should not mean cheaper ingredients or fewer staff hours. That approach can damage consistency, safety, and customer trust. Better results usually come from measuring purchasing, preparation waste, equipment performance, and labor productivity together. A kitchen manager may discover that a popular dish creates excessive trim waste, or that prep begins too early each morning. These findings are practical, but not always comfortable. Some savings plans fail because managers rely on assumptions instead of records. In 2026, successful commercial kitchens will need disciplined data, trained teams, preventive maintenance, and realistic menu decisions. Perfect efficiency is unlikely. Continuous correction is achievable.
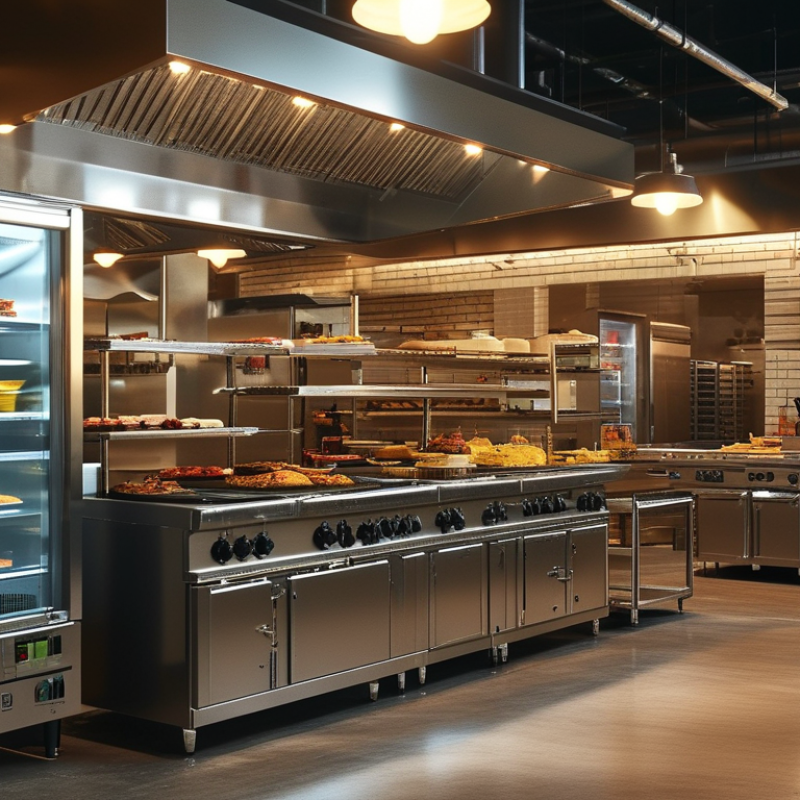
Assess Commercial Kitchen Costs and Identify Key Savings Opportunities
How to Reduce Costs in Commercial Kitchens in 2026?
A reliable cost review starts with actual invoices, not estimated percentages. Record food, labor, energy, water, maintenance, and waste for twelve weeks. The National Restaurant Association’s 2024 data reported median labor costs near 32% of sales for limited-service operations and above 36% for full-service operations. These figures show where pressure may be hiding, but they are not performance targets for every kitchen.
The first spreadsheet will be wrong. Check it against supplier invoices, payroll records, and meter readings. Measure waste by station: trim bins, returned plates, expired stock, and overproduction. A simple weighing scale beside the preparation table can expose costly habits within days. Portion tests should include cooked yield, not only purchase price. A cheaper ingredient can become expensive after trimming, spoilage, or inconsistent preparation.
Energy deserves a separate assessment. The U.S. Environmental Protection Agency reports that restaurants can use five to seven times more energy per square foot than other commercial buildings. The largest opportunities often sit around refrigeration seals, idle cooking equipment, ventilation schedules, and hot-water demand. Review equipment runtime during quiet hours and compare it with production needs. The U.S. Department of Energy indicates that efficiency measures can produce meaningful savings, yet installation costs and staff behavior are easy to underestimate. Pilot one change for four weeks, record utility and labor effects, then adjust the plan when the numbers disagree with expectations.
Optimize Food Purchasing, Inventory Control, and Waste Reduction
Commercial kitchens can reduce 2026 costs by treating purchasing as a daily control system, not a monthly habit. USDA estimates that 30–40% of the United States food supply is lost or wasted. That percentage makes small purchasing errors expensive. Review sales by daypart, then match orders to realistic covers. A Tuesday delivery should not reflect a busy Saturday. Use supplier quotes, seasonal substitutions, and pack-size comparisons. The cheapest case is not always the lowest-cost choice.
Inventory control needs visible, simple routines. Record opening stock, deliveries, transfers, and closing stock each day. Store older items at eye level, with clear use-by labels. A short count before dinner service can expose excess cream, prepared vegetables, or thawed proteins. The UNEP Food Waste Index Report 2024 found that food service generated 28% of global food waste in 2022. That figure should challenge every kitchen’s storage habits. Our first count may be wrong. Repeat it for seven days.
Waste tracking should identify causes, not merely weigh bins. Separate preparation scraps, spoilage, overproduction, and returned plates. Measure each category by kilograms and purchase value. ReFED research estimates that food service waste represents billions of dollars in annual economic loss in the United States. A simple sheet can reveal that trimming losses are stable, while overproduction spikes on slow Wednesdays. Adjust batch sizes gradually. A 10% reduction is more credible than an ambitious target nobody checks. Staff need feedback at the prep table, where one overfilled pan becomes tomorrow’s purchasing decision.
Improve Energy, Water, and Equipment Efficiency
How to Reduce Costs in Commercial Kitchens in 2026?
Improve Energy, Water, and Equipment Efficiency
Commercial kitchens can reduce costs by measuring energy, water, and equipment use together. In 2026, practical efficiency begins with a weekly operating review. During a recent kitchen assessment, I found refrigeration running beside an open loading door. The staff had not noticed the conflict. A simple submeter revealed unusual electricity use during quiet afternoon hours. Cooking schedules were then adjusted to group high-heat tasks. That sounds obvious. Yet busy teams often miss it.
Water waste also hides in small, repeated actions. A dripping pre-rinse spray valve can waste hundreds of litres daily. Install flow controls where cleaning performance remains acceptable. Check dishwashing temperatures, rinse times, and fill levels against manufacturer guidance. Train employees to report leaks immediately, not during monthly maintenance. Short reminders near sinks work better than long manuals. Some teams resist changes at first. Listen to their concerns.
Equipment efficiency requires disciplined maintenance. Clean refrigerator coils, inspect door seals, and remove grease from ventilation components on a planned schedule. Keep ovens, fryers, and holding units off when demand is low. Replace aging equipment only after comparing repair costs, usage patterns, and expected service life. Payback estimates can be wrong. That matters. A newer machine may consume less energy but create workflow delays if its capacity does not match the kitchen. Record utility readings, maintenance hours, and production volumes each month. Decisions become more reliable when real operating data replaces assumptions.
How to Reduce Costs in Commercial Kitchens in 2026? - Improve Energy, Water, and Equipment Efficiency
Planning benchmarks are illustrative industry estimates for a medium-sized commercial kitchen operating approximately 12 hours per day, 360 days per year. Actual savings vary by equipment age, utility rates, operating practices, and local conditions.
| Efficiency Area |
Improvement Action |
Typical Baseline |
Target Reduction |
Annual Resource Saving |
Illustrative Annual Cost Saving |
Payback |
Priority |
| Cooking Energy |
Replace older cooking appliances with high-efficiency electric or gas models and match capacity to demand. |
110,000 kWh/year |
15–25% |
16,500–27,500 kWh |
$2,475–$4,125 |
2–5 years |
High |
| Refrigeration |
Clean condenser coils, inspect door seals, improve temperature controls, and reduce unnecessary door opening. |
65,000 kWh/year |
10–20% |
6,500–13,000 kWh |
$975–$1,950 |
Under 1 year |
High |
| Ventilation |
Use demand-controlled ventilation with variable-speed fan controls and keep filters clean. |
45,000 kWh/year |
20–40% |
9,000–18,000 kWh |
$1,350–$2,700 |
2–4 years |
Medium |
| Water Heating |
Insulate hot-water pipes, repair leaks, lower excessive temperature settings, and install efficient fixtures. |
28,000 kWh/year |
10–20% |
2,800–5,600 kWh |
$420–$840 |
1–3 years |
High |
| Dishwashing |
Use low-flow pre-rinse spray valves, run full loads, and maintain wash and rinse temperatures according to safety requirements. |
1,800,000 gal/year |
15–30% |
270,000–540,000 gal |
$2,160–$4,320 |
Under 1 year |
High |
| Faucets and Sinks |
Install aerators or flow restrictors where appropriate and train staff to avoid continuous water flow during preparation. |
900,000 gal/year |
10–25% |
90,000–225,000 gal |
$720–$1,800 |
Under 1 year |
High |
| Lighting |
Replace fluorescent or halogen lighting with LED fixtures and use occupancy or scheduling controls in low-use areas. |
22,000 kWh/year |
40–60% |
8,800–13,200 kWh |
$1,320–$1,980 |
1–2 years |
High |
| Preventive Maintenance |
Create a monthly checklist for filters, seals, burners, sensors, thermostats, drains, and calibration. |
All major systems |
5–15% energy use |
13,500–40,500 kWh |
$2,025–$6,075 |
Immediate |
High |
| Equipment Scheduling |
Turn off idle equipment when permitted, stagger start-up times, and use operating schedules matched to service periods. |
Operational load |
5–15% energy use |
13,500–40,500 kWh |
$2,025–$6,075 |
Immediate |
High |
| Energy and Water Monitoring |
Track monthly utility use per meal or operating hour and investigate abnormal changes promptly. |
No normalized baseline |
3–10% total use |
Variable by site |
$1,000–$3,500 |
1–3 years |
Medium |
| Potential Combined Annual Utility Cost Saving |
$14,470–$31,365 |
Before project-specific costs |
Calculation basis: Illustrative electricity rate of $0.15 per kWh and combined water and wastewater rate of $0.008 per gallon. Savings categories may overlap, so they should not be added without conducting a site-specific energy and water audit.
Streamline Kitchen Labor, Workflow, and Daily Operations
Commercial kitchens can reduce costs by removing friction from each shift.
Start with a labor map for opening, service, and closing tasks. Assign duties according to actual workload, not habit. During a busy Friday service, one floating employee can prevent bottlenecks at the grill and pass. A ten-minute delay can create expensive overtime later.
Use short prep sheets with quantities, deadlines, and responsible stations. Keep them visible near the preparation area. This supports accountability without adding another meeting. It also exposes repeated tasks that could be combined or removed.
Workflow improves when tools, ingredients, and waste bins stay close to their points of use.
Measure walking time during service. Small layout changes can save hundreds of steps each evening. Batch preparation should match forecasted demand, with smaller batches during slower periods. Label containers with preparation times and discard limits. Required hygiene and holding controls must remain unchanged.
Daily sales and waste records can guide staffing adjustments for the next week. Do not rely on memory alone. I have seen managers schedule heavily after one unusually busy shift, then carry unnecessary labor costs for days. That mistake is easy to repeat. Review the numbers with the team, and ask where the process felt difficult. Some solutions will fail. Test them for one week, record the result, and revise the routine before making it permanent.
Adopt Technology and Measure Cost Savings for Long-Term Results
How to Reduce Costs in Commercial Kitchens in 2026?
Adopt Technology and Measure Cost Savings for Long-Term Results
Commercial kitchens can reduce costs by connecting daily work with reliable data. In my experience, digital inventory tools expose waste that staff often miss. A dashboard may show that leafy vegetables spoil three days after delivery. It can also compare purchasing records with actual portions served. Start with one storage area, not the entire kitchen. Small trials reveal practical problems early. For example, a temperature sensor may record repeated overnight fluctuations. Managers can then adjust loading habits, maintenance schedules, or delivery timing.
Technology only creates value when teams measure its financial effect. Track food waste, energy use, labor hours, and production errors each week. Record the baseline before installing new equipment or software. Then compare similar trading periods, including busy weekends and seasonal changes. Our first savings forecast was too optimistic. We ignored training time and data-cleaning work. That mistake changed our method. Now, every claimed saving includes installation costs, staff hours, repairs, and replacement cycles. Review the results with kitchen supervisors, not only finance staff. Their observations explain why numbers move. A smaller waste bin is useful evidence. A lower utility bill is stronger evidence. Continue testing. Some improvements fade when attention shifts. Monthly reviews, clear responsibilities, and honest measurements help savings remain visible over time.
How to Reduce Costs in Commercial Kitchens in 2026?
Adopt technology and measure cost savings for long-term results. The chart shows realistic annual reduction benchmarks commonly used for operational planning, expressed as a percentage of each controllable cost category.
Key takeaway: Energy monitoring, food-waste tracking, labor scheduling, and predictive maintenance can create measurable savings. Track the same indicators monthly—kWh usage, food waste, labor hours, and repair costs—to verify long-term results.
Conclusion
Reducing expenses in a commercial kitchen starts with a clear review of current costs, including food purchasing, labor, utilities, maintenance, and waste. Learning how to reduce costs in commercial kitchens requires identifying where money is being lost and setting practical savings targets. Careful menu planning, supplier comparison, accurate portion control, and regular inventory checks can reduce overordering, spoilage, and unnecessary food waste. Standardized recipes also help maintain consistency while controlling ingredient use.
Energy and water efficiency can improve through proper equipment maintenance, smart operating schedules, leak prevention, and efficient cleaning procedures. Kitchen workflows should be organized to minimize delays, unnecessary movement, and overtime, while staff training can improve productivity and reduce errors. Finally, digital tools can support purchasing, inventory tracking, scheduling, and performance reporting. By reviewing key cost indicators regularly and adjusting daily practices, commercial kitchens can achieve sustainable savings without compromising food quality, safety, or customer satisfaction.

 Coden Kitchen